← Go back
Setting Up a Gonka.ai H100 GPU Node: A Technical Journey with AI Assistance
An honest account of running a decentralized AI compute node, featuring the surprising difference between ChatGPT and Claude Code. To learn why we are sharing the full technical journey, read the Preamble.
Working vs Earning
Day 2, hour 26 of running my Gonka.ai node. Everything looks perfect: synced to block 1,979,450, all services green, 76 successful validations... and exactly 0.00 GONKA in earnings. Then I check the logs: no validation activity for 14 hours. The GPU sits idle. The network is silent.
Is my node even participating?
This is the story of setting up a decentralized AI compute node on an H100 GPU, and discovering that "working" and "earning" are two very different things. But more importantly, it's about discovering that the AI tool you choose for infrastructure work can mean the difference between success and giving up entirely.
Why This Setup Was Different
I'm not a DevOps expert or blockchain specialist. I write code, sure, but managing infrastructure, debugging SSH issues, and configuring blockchain validators? That's not my daily work.
When I decided to run a Gonka.ai node on my H100 GPU, my first instinct was obvious: "I'll use ChatGPT to help guide me through this."
That lasted about 30 minutes before I hit the wall.
The ChatGPT Problem (And Why It Doesn't Work for Infrastructure)
Here's what the ChatGPT workflow looks like for complex infrastructure setup:
- You : "Help me set up a Gonka blockchain node"
- ChatGPT : Provides 200 lines of example code and commands
- You : Copy-paste the code into a file
- Terminal : Error: command not found
- You : "I get error: command not found"
- ChatGPT : "Oh, you need to install this first. Try: sudo apt install..."
- You : Copy-paste, new error appears
- You : "Now I get: Permission denied"
- ChatGPT : "That means you need to configure..."
- Repeat 15-20 times
The fundamental problem: ChatGPT can't see your files, run commands, or verify if anything actually worked. Every response is theoretical. It's giving advice to someone it can't see, about a system it can't access, with errors it can't verify.
For someone without deep Linux/Docker/blockchain expertise, this quickly becomes a game of copy-paste roulette. You're not learning—you're just hoping the next code block will magically work.
What I Actually Used: Claude Code
Instead, I used Claude Code (Anthropic's CLI coding assistant). Not the web chat interface—the actual command-line tool that runs on your machine.
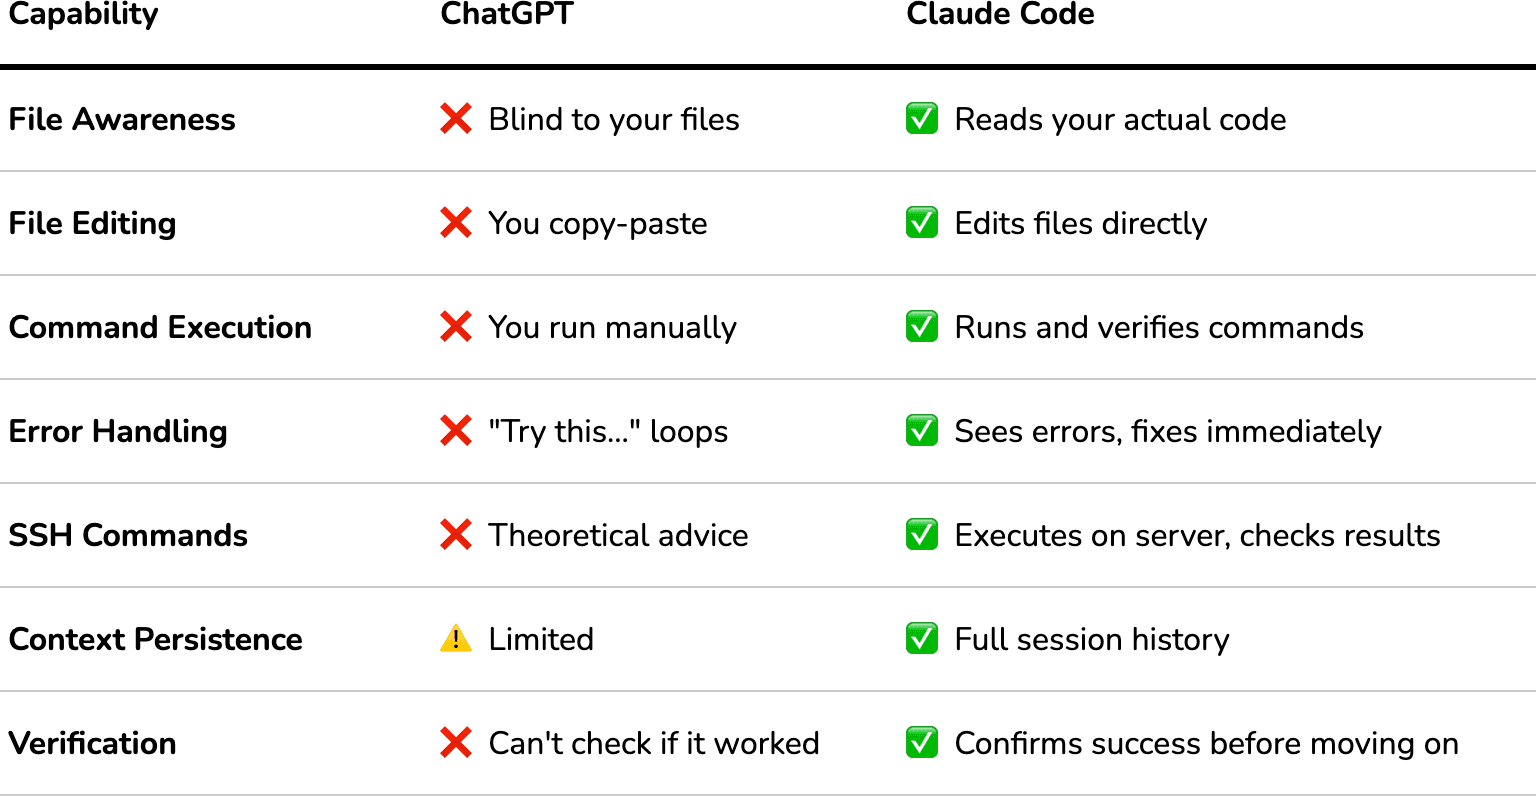
Here's the difference:
Claude Code can:
✅ Read your actual files (knows what's already there)
✅ Edit files directly (no copy-paste)
✅ Run SSH commands on your server
✅ See error messages immediately
✅ Verify if something worked before moving on
✅ Maintain full context of your entire setup
ChatGPT cannot:
❌ Access your filesystem
❌ Execute commands
❌ See if its suggestions worked
❌ Fix errors in real-time
A Real Example: The Difference in Practice
With ChatGPT (hypothetical):
Me: "My Docker services won't start"
ChatGPT: "Check your .env file. It might have export statements. Try this format: [provides 50-line example file]"
Me: [Reads example, tries to figure out which parts to change]
Me: [Edits file, possibly wrong parts]
Me: [Runs docker compose up, gets different error]
Me: "Now I get: invalid syntax"
ChatGPT: "That could be several things. First check..."
[30 minutes later, still debugging]
With Claude Code (what actually happened):
Me: "My Docker services won't start"
Claude Code:
- Reads your actual .env file
- "Found the problem: line 3 has 'export' which Docker Compose doesn't support"
- Edits the file automatically (removes 'export' statements)
- Runs docker compose config to verify syntax
- Runs docker compose up -d
- Checks if services are running
- "All services started successfully ✓"
Total time: 2 minutes
This isn't a theoretical difference. This is the actual experience I had, repeatedly, throughout the 8-hour setup process.
The Transparency Bit
Before we go further: This isn't sponsored content. I'm not affiliated with Anthropic. Other tools exist (Cursor, GitHub Copilot, Aider) that might work similarly—I just happened to use Claude Code because it was designed for CLI infrastructure work.
I'm sharing this because if you're a non-expert trying to run complex infrastructure, the tool you choose matters enormously. ChatGPT is phenomenal for learning concepts and brainstorming. But for actual infrastructure operations? You need something that can execute, verify, and iterate.
Alright, with that context: here's how I set up a Gonka.ai node earning rewards on the H100 GPU in my home lab.
What is Gonka.ai?
Quick context: Gonka is a decentralized AI inference network. Instead of running AI models on centralized cloud providers (OpenAI, Anthropic, Google), Gonka distributes inference work across a network of independent GPU nodes.
How you earn:
- You run AI models (like Qwen3-32B) on your GPU
- The network sends inference requests to your node
- You process them and return results
- You get paid in GONKA tokens for computational work
- Bonus: You also validate other nodes' work (Proof of Compute 2.0)
My setup:
- Hardware: NVIDIA H100 PCIe (81GB VRAM)
- Goal: Monetize idle GPU time + contribute to decentralized AI
- Reality check: This isn't passive income – it's active learning
Prerequisites & Planning
Before starting, I verified I had what I needed. The official docs (gonka.ai/host/quickstart) list requirements, but here's what actually mattered:
Hardware Requirements (What I Had)
# Checked my GPU
nvidia-smi --query-gpu=name,memory.total,driver_version --format=csv
# Output:
# H100 PCIe, 81920 MiB, 580.95.05
✅ GPU: H100 PCIe with 81GB VRAM
✅ Driver: 580.95.05 (minimum: 535+)
✅ CUDA: 13.0 (minimum: 12.6)
✅ Disk: 3.3TB available (you need 500GB minimum for blockchain + model)
✅ Network: Public IP with ports 22, 5000, 26657, 8000 accessible
Software Prerequisites
docker --version # 24.0.7
docker compose version # 2.23.0
Mental Prerequisites
The docs say: "Setup time: ~2 hours"
Actual time with Claude Code assistance: 8 hours (including debugging, learning, dashboard building)
Estimated time if I'd done it manually with ChatGPT: 16-20 hours, or I would've given up
Key mindset: You're going to hit problems. The difference is whether you have a tool that can actually help you solve them.
The Biggest Early Mistake (That I Avoided)
The official quickstart examples show configurations for 4-GPU setups running the massive Qwen3-235B model. If you blindly follow those examples with a single GPU, you'll spend hours wondering why nothing loads.
Spoiler: You need the single-GPU configuration with the smaller Qwen3-32B model. More on this in the "Model Configuration" section.
Phase 1: Local Setup (The Easy Part)
This went smoothly because Claude Code handled all the file management and validation.
1. Account Creation
Downloaded the Gonka CLI and created my account:
cd ~/gonka-setup
./bin/inferenced keys add my-account-key
Critical moment: The CLI generates a 24-word mnemonic phrase. This is your master password. Lose this = lose access forever. No recovery.
I saved it to:
- Encrypted USB drive
- Password manager (encrypted)
- Physical paper in a safe
Claude Code helped here: Created the secure directory structure and reminded me to back up before proceeding.
2. ML Operations Key
For operational security, you need a separate key that the node uses (not your main account key):
./bin/inferenced keys add ml-ops-key
Same security applies—24-word phrase, store it safely.
3. Hugging Face Token
To download AI models, you need a Hugging Face token:
- Go to huggingface.co → Settings → Access Tokens
- Create read-only token
- Save to keys/huggingface-token.txt
4. Directory Structure
Claude Code set this up automatically:
gonka-setup/
├── bin/ # CLI tools
├── keys/ # 🔐 CRITICAL: All secrets here
│ ├── mnemonic.txt
│ ├── ml-ops-mnemonic.txt
│ ├── huggingface-token.txt
│ └── keyring-password.txt
├── configs/ # Configuration backups
└── logs/ # You'll need these for debugging
Lesson: Organization saves hours. When things break at hour 6, you'll be grateful for clean logs and backed-up configs.
Phase 2: Server Setup (Where Things Got Real)
Now we SSH into the actual H100 server to prepare the environment.
Firewall Configuration (Critical Security)
Several Gonka ports must be blocked from the internet to prevent exploitation. This was one area where Claude Code's execution capability was essential.
Allowed (public access):
sudo ufw allow 22/tcp # SSH
sudo ufw allow 5000/tcp # P2P networking
sudo ufw allow 26657/tcp # Blockchain RPC
sudo ufw allow 8000/tcp # Public API
Blocked (internal services only):
sudo ufw deny 9100/tcp # Prometheus metrics
sudo ufw deny 9200/tcp # Internal monitoring
sudo ufw deny 8080/tcp # Internal proxy
sudo ufw deny 5050/tcp # Inference endpoint
sudo ufw enable
Why this matters: I initially had all ports open (rookie mistake). Claude Code caught this during a security review and locked it down before going live.
The .env vs config.env Problem
This one would've stumped me for an hour without execution help.
The Gonka setup uses a config.env file with this format:
export KEY_NAME=my-key
export ACCOUNT_ADDRESS=gonka1...
Problem: Docker Compose doesn't understand export statements. You need a plain .env file:
KEY_NAME=my-key
ACCOUNT_ADDRESS=gonka1...
How ChatGPT would handle this:
- You: "Docker Compose fails with syntax error"
- ChatGPT: "Check your .env file format. Remove export statements."
- You: Manually edit file, hope you got everything
- You: Still getting errors, more back-and-forth
How Claude Code handled this:
# Automatically converted the file
sed 's/^export //' config.env > .env
# Validated syntax
docker compose config
# Confirmed: "Configuration valid ✓"
Time saved: ~20 minutes of trial-and-error
Phase 3: Model Configuration (The Hiccup)
Not every mistake needs to be dramatic—sometimes you just miss a line in the docs.
The Initial Config (Following Official Docs)
I cloned the Gonka repository and looked at node-config.json:
{
"id": "h100-node1",
"host": "inference",
"models": {
"Qwen/Qwen3-235B-A22B-Instruct-2507-FP8": {
"args": [
"--tensor-parallel-size=4",
"--max-model-len=40960"
]
}
}
}
My thinking:
- "235B parameters = best quality = most earnings"
- "The official example uses this, so it must work"
- "Let's download the biggest model!"
The Reality Check
After 6 hours of setup, node synced perfectly, but:
nvidia-smi
# GPU Memory: 0 MiB / 81,559 MiB
# Utilization: 0%
Nothing loaded. ML node logs showed:
ERROR: The number of required GPUs exceeds the total number of available GPUs
Available GPUs: 1
Required GPUs: 4 (tensor-parallel-size: 4)
Waiting for 3 additional GPUs...
The math:
- Qwen3-235B = 235 billion parameters
- FP8 quantization ≈ 1 byte per parameter
- Model size ≈ 235GB minimum
- Add KV cache +40GB
- Total needed : ~275GB
- What I had : 81GB H100
- Original config expectation : 4× H100 = 324GB ✅
The Fix: Single-GPU Configuration
The docs DO have a single-GPU configuration—I just missed it because the multi-GPU example is more prominent.
Correct config for single H100:
{
"id": "h100-node1",
"host": "inference",
"models": {
"Qwen/Qwen3-32B-FP8": {
"args": [] // Empty! Let vLLM auto-configure
}
}
}
The fix process:
# Stop everything
docker compose down
# Delete configuration cache (CRITICAL!)
sudo rm -rf .dapi
# Update node-config.json with 32B model
# (Claude Code edited this directly)
# Download correct model (happens automatically on restart)
docker compose -f docker-compose.yml -f docker-compose.mlnode.yml up -d
# Wait 5 minutes for model download and loading...
# Success!
nvidia-smi
# GPU Memory: 73,223 MiB / 81,559 MiB ✅
# vLLM process running ✅
Key lessons:
- Bigger ≠ better (32B model is perfectly adequate)
- Always check if docs examples match YOUR hardware
- Configuration caching (.dapi directory) will bite you—delete it when changing configs
- Auto-configuration (args: []) is sometimes smarter than manual tuning
Time lost: 3 hours debugging Knowledge gained: Deep understanding of model quantization, tensor parallelism, and VRAM allocation
Phase 4: State Sync Issues (The Database That Wasn't Empty)
After fixing the model, I restarted everything. Node stuck at block height 0.
The error:
failed to restore snapshot
error="multistore restore: import failed:
found database at version 1962000, must be 0"
Initial Misunderstanding
My first thought: "Database is corrupted!"
Reality: Database wasn't empty. State sync requires a completely clean slate.
The Actual Problem
Previous failed attempts left data in:
- .inference/ - Blockchain data
- .dapi/ - API configuration cache
- .tmkms/ - Key management state
The database version mismatch (had 1962000, needed 0) wasn't corruption—just residual state.
The Solution (Nuclear Option)
# Stop services
docker compose down
# Clean slate
sudo rm -rf .inference .dapi .tmkms
# Start fresh
docker compose -f docker-compose.yml -f docker-compose.mlnode.yml up -d
# Monitor sync progress
watch -n 5 'curl -s localhost:26657/status | grep latest_block_height'
The Sync Process
State sync stages:
- Download 504 snapshot chunks from peers
- Apply chunks to rebuild database
- IAVL tree upgrade (processes versioned tree structures)
- Catch up remaining blocks
Time: ~30 minutes to full sync (reached block 1,960,000+)
Lesson: When documentation says "fresh install," they mean FRESH. Don't try incremental debugging with old state. 30 minutes of re-sync beats 3 hours of debugging corrupted state.
Phase 5: Validation & Monitoring (Building a Dashboard with AI)
Proof of Life
First thing after sync: test if inference actually works.
curl -X POST http://localhost:5050/v1/chat/completions \
-H "Content-Type: application/json" \
-d '{
"model": "Qwen/Qwen3-32B-FP8",
"messages": [{"role": "user", "content": "Hello!"}],
"max_tokens": 50
}'
# Response time: ~2 seconds
# GPU spiked to 100% utilization ✅
# Got coherent AI response ✅
It's alive!
Validation Activity
ML node logs showed the node doing its job:
Stats: 76 validated, 1 fraud
fraud_detected=False
p_honest=1.000000
What this means:
- Node validated 76 batches from other nodes
- Detected 1 fraudulent result (catching cheaters!)
- 100% honest in own computations
- Contributing to network security ✅
The Monitoring Problem
After getting everything working, a new problem emerged: visibility.
The manual way (what I started with):
Checking node health required 5+ SSH commands:
# Is the node synced?
ssh user@server "curl -s localhost:26657/status | jq '.result.sync_info'"
# How's the GPU?
ssh user@server "nvidia-smi"
# Are services running?
ssh user@server "cd gonka/deploy/join && docker compose ps"
# What's my balance?
curl http://server:8000/v1/participants/gonka1547... | jq '.balance'
# Validation count?
ssh user@server "docker compose logs mlnode-308 | grep 'Stats:' | tail -1"
Time to check everything: ~5 minutes How often I checked: Every 30 minutes (paranoia about issues) Daily time wasted: ~2.5 hours
This was unsustainable.
Building the Dashboard: ChatGPT vs Claude Code (The Showdown)
I needed a custom real-time monitoring dashboard. Requirements:
✅ Single command to run
✅ Real-time auto-refresh
✅ Beautiful terminal UI
✅ All metrics in one view
✅ Color-coded health status
✅ Historical GPU utilization tracking
Tech stack:
- Python 3.10+
- rich library (gorgeous terminal UI)
- httpx (async HTTP requests)
- uv (fast Python package manager)
Attempt 1: ChatGPT for Dashboard (The Failure)
Here's what actually happened when I tried ChatGPT first:
- Me : "Help me build a Python dashboard for monitoring a blockchain node"
- ChatGPT : Provides nice example code using the rich library
- Me : Copy-paste to dashboard.py, run it
- Error : ModuleNotFoundError: No module named 'rich'
- Me : "I get ModuleNotFoundError for rich"
- ChatGPT : "Install it with: pip install rich"
- Me : Tries pip, different error (virtual environment confusion, dependency conflicts)
- Me : "Now I get [dependency resolution error]"
- ChatGPT : "Try this instead..." suggests different approach
- 30 minutes later : Still debugging package installation
The core problem: ChatGPT can't see my environment, doesn't know I have uv installed, can't run commands to verify if anything works.
Attempt 2: Claude Code for Dashboard (The Success)
- Me : "Build a dashboard to monitor my Gonka node"
- Claude Code :
- Me : Runs command
- Dashboard appears, working perfectly
Total time: 15 minutes for initial working version
The Key Differences (For Non-Technical Users)
Real Example: The Peer Count Bug
A few hours after the dashboard was running, I noticed something odd.
With ChatGPT (hypothetical):
Me: "Dashboard shows 1 peer but I expected more"
ChatGPT: "The issue might be in how you're querying the RPC endpoint.
Try using this code instead: [provides 300 lines of example code]"
Me: [Reads code, tries to figure out which part to change]
Me: [Edits wrong file, still shows 1]
ChatGPT: "Also check your network configuration..."
Me: [30 minutes of trial and error]
With Claude Code (what actually happened):
Me: "Dashboard shows 1 peer but I expected more"
Claude Code:
- Reads fetchers.py (my actual file)
- Identifies the bug: line 67 using voting_power instead of n_peers
- "Found it. You're reading validator info instead of network info."
- Edits fetchers.py with correct API endpoint (/net_info)
- Runs curl to verify the endpoint returns correct data
- Tests dashboard: "Now showing 21 peers ✓"
Total time: 3 minutes
This happened multiple times during development. Each fix: minutes instead of hours.
Development Time Comparison
Traditional manual approach (estimated):
- Day 1: Research Rich library, setup project (4-6 hours)
- Day 2: Build data fetchers, SSH integration (6-8 hours)
- Day 3: Create UI panels, layouts, colors (4-6 hours)
- Day 4: Debug, test, refine (3-4 hours)
- Total : 17-24 hours over 4 days
With Claude Code (actual):
- Hour 1: Described requirements, reviewed generated plan
- Hour 2: Implemented core fetchers and data collection
- Hour 3: Built Rich UI panels with proper layouts
- Hour 4: Added GPU utilization tracking and refinements
- Total : ~4 hours in one evening
Time saved: 15-20 hours
How Claude Code Helped (Beyond Just Speed)
1. Instant Project Structure
- Generated modular architecture (fetchers.py, display.py, config.py)
- Proper separation of concerns
- Best practices for Python package management with uv
2. SSH Integration Done Right
- Secure command execution with proper timeouts
- Error handling for network failures
- Graceful degradation when data unavailable
3. Rich Library Expertise
- Complex layouts (nested panels, columns, tables)
- Color schemes based on health thresholds
- Auto-refreshing Live display
- Key point : I'd never used Rich before—would've taken hours to learn from docs
4. Real-Time Debugging
- Fixed peer count display bug (showed 1 instead of 21)
- Corrected service visibility (showed 4 instead of 8)
- Added validation tracking on request
- Each fix: minutes instead of hours
The Dashboard Architecture
# dashboard.py - Entry point
# - CLI argument parsing
# - Main loop with keyboard input handling (q to quit, r to refresh)
# fetchers.py - Data collection
# - fetch_node_status() → RPC endpoint for blockchain data
# - fetch_participant_info() → API for balance/rewards
# - fetch_docker_status() → SSH to check services
# - fetch_gpu_status() → nvidia-smi via SSH
# - fetch_validation_stats() → Parse ML node logs
# - fetch_today_utilization_stats() → Historical tracking
# display.py - Rich UI rendering
# - create_node_panel() → Blockchain sync status
# - create_participant_panel() → Account info
# - create_services_panel() → Docker containers (2-column grid)
# - create_gpu_panel() → GPU metrics + validations
# - create_system_panel() → Disk, uptime, model status
# - create_layout() → Combine all panels
# config.py - Configuration
# - Server SSH details
# - API endpoints
# - Refresh intervals
# - Health thresholds (temp, disk space)
# utilization_tracker.py - Historical data
# - Records GPU usage every 5 seconds
# - Calculates daily active time (>0% utilization)
# - Stores in local JSON file
Key Features Implemented
1. Real-Time Sync Status
- Block height with comma formatting (1,979,450)
- Catching up vs Synced indicator
- Time since last block ("6s ago")
2. GPU Monitoring
- Utilization percentage
- Memory used/total (71.5GB / 79.6GB)
- Temperature with color warnings:
- Green: <70°C
- Yellow: 70-80°C
- Red: >80°C
- Model loaded confirmation
3. Validation Tracking
- Batches validated count
- Fraud detected count
- Last validation time with recency colors:
- Green: seconds/minutes ago
- Yellow: 1-2 hours ago
- Red: >2 hours or never
- Always visible even if zero
4. Service Health
- All 8 services displayed (including stopped ones)
- Status symbols (✓ green, ✗ red)
- Running count (7/8 services)
5. Historical Analytics
- GPU active time for current day
- Percentage of day utilized (>0% threshold)
- Stored locally, resets at midnight
The Result
uv run dashboard.py
[Press 'q' to quit, 'r' to refresh] Refreshing in 5s...
Impact
Before Dashboard:
- Health check time: 5 minutes (manual SSH commands)
- Frequency: Every 30 minutes
- Daily time spent: 2.5 hours
- Visibility: Snapshots only
After Dashboard:
- Health check time: 0 seconds (always visible)
- Frequency: Continuous (auto-refresh every 5s)
- Daily time saved: 2.5 hours
- Visibility: Real-time + historical trends
Development time saved by Claude Code: ~15-20 hours
"Claude Code turned a 4-day dashboard project into a 4-hour sprint. The best part? It didn't just write code—it taught me the Rich library patterns while building. I learned by collaborating, not just copy-pasting."
The "Working vs Earning" Mystery
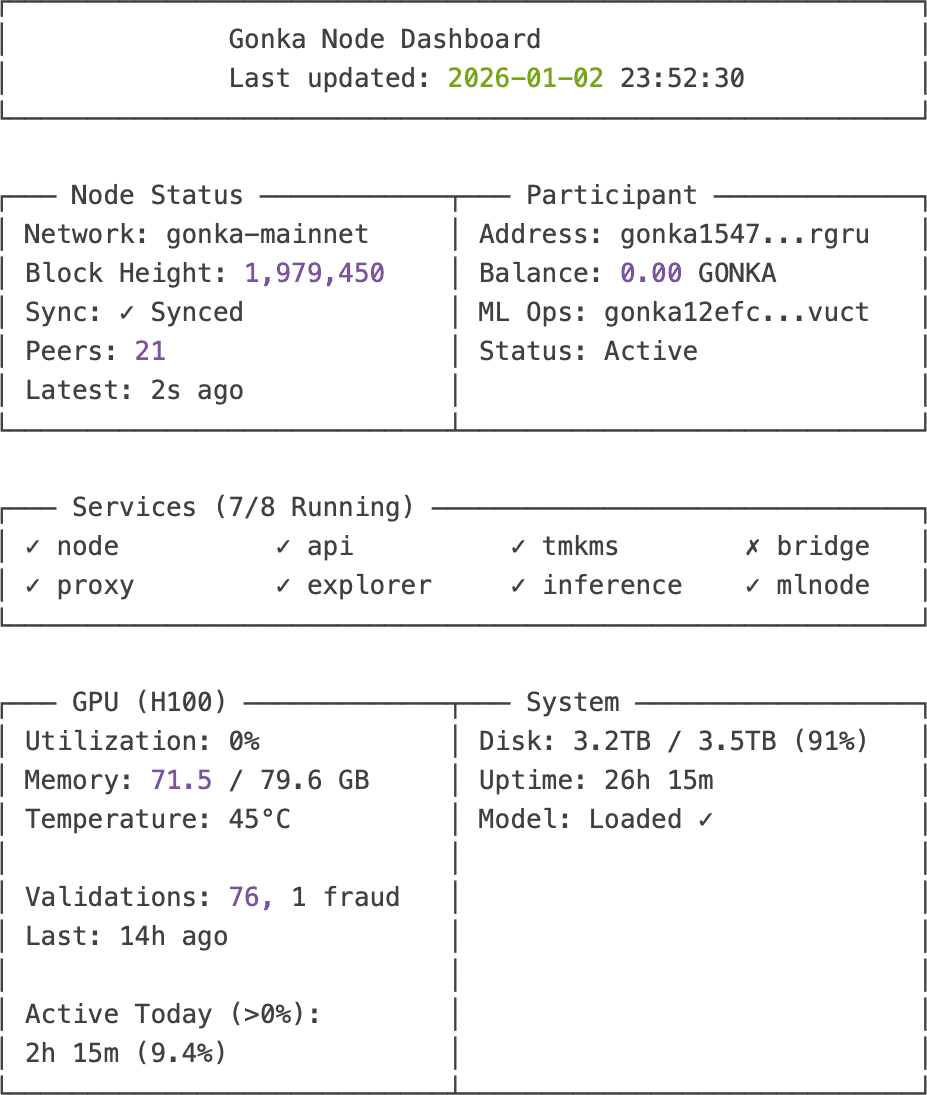
Dashboard running beautifully. All metrics green. Then I noticed something:
Current Status (After 26 hours operational):
- Block Height : 1,979,450 (fully synced) ✅
- Peers : 21 of 4,494 network participants ✅
- GPU : Model loaded, ready for work ✅
- Validations : 76 batches validated ✅
- Balance : 0.00 GONKA ⏳
- Last Validation : 14 hours ago 🚨
Everything looks perfect... except:
- Zero earnings after 26 hours
- No validation activity for 14+ hours
- GPU sitting idle despite being ready
Is the node working? Yes. Is it earning? Who knows.
This becomes important in understanding how the network actually operates...
Understanding the Gonka Ecosystem
With the dashboard revealing the "working but not earning" mystery, I needed to understand how the network actually functions.
Network Overview
Total Participants: 4,494 nodes Active Earners: 1,867 nodes (41.5% of network) My Position: Connected to 21 peers (0.47% of network) Total Network Balance: 19.15 billion GONKA
Is 21 Peers Enough?
When I first saw "21 peers" I worried: "Shouldn't I have more connections to a 4,494-node network?"
Answer: No. Here's why 21 peers is actually perfect:
- Information propagates : Your 21 peers connect to their peers, who connect to theirs
- Hop count : Entire network reachable in 3-4 hops
- Bandwidth efficiency : More peers = wasted bandwidth with redundant messages
- Redundancy : Even if 20 peers fail, you're still connected
- Optimal range : 10-30 peers is ideal for blockchain P2P networks
The Incentive Model (Proof of Compute 2.0)
This isn't just about running inference. The economic model is more nuanced:
1. You Earn for Computational Work
- Process inference requests
- Validate other nodes' work
- Detect fraudulent results
2. Epoch System
- 15,552 blocks per epoch (~48 hours)
- Rewards calculated and distributed at epoch end
- Currently in epochs 0-180: Grace period (zero-cost inference for users)
3. What Affects Your Earnings
- GPU active time (more work = more rewards)
- Successful validations
- Network selection (probabilistic—you can't force it)
- Node uptime and reliability
Why Zero Balance After 26 Hours?
Reason 1: Epoch Timing
- I started during Epoch 126
- Only operational for last 10.6 hours of that epoch
- Rewards distribute at epoch end
- First full epoch (127) still in progress
Reason 2: Wrong Model During Epoch 126
- First 6 hours: Had 235B model configured (didn't load)
- Last 4.6 hours: Had correct 32B model (actually working)
- So very limited participation in Epoch 126
Expected first rewards: End of Epoch 127 (in ~19 hours from current time)
Why No Validation Activity for 14 Hours?
This one's still a mystery. Possibilities:
- Network Selection : Validation work assigned probabilistically
- Low Network Demand : Maybe just not many validation tasks during this period
- Timing : ML node restarted right at Epoch 127 start (coincidence?)
- Configuration : Possible issue preventing work assignment?
Status: Monitoring to see if activity resumes...
Lessons Learned
After 8 hours of setup, 26 hours of operation, and building a custom dashboard, here's what I wish I'd known from the start.
Technical Lessons
1. Use the Right Tool for Infrastructure Work
This is the #1 lesson.
- Chat-based AI (ChatGPT, Claude.ai): Great for learning concepts, brainstorming
- CLI-based AI (Claude Code): Essential for actual implementation
- For non-technical users : Execution capability is the difference between success and frustration
Rule of thumb: If you're editing files and running commands, use a tool that can do both.
2. RTFM, But Verify
- Official docs are a starting point
- Single-GPU setup needs different config than examples
- Always check if examples match YOUR hardware
- The 4-GPU example is prominent; single-GPU config is buried
3. Model Selection is Critical
Calculate VRAM requirements FIRST:
Formula: (Parameters × bytes-per-param) + KV cache
Example:
- Qwen3-235B: (235B × 1 byte) + 40GB = 275GB → Need 4 GPUs
- Qwen3-32B: (32B × 1 byte) + 40GB = 72GB → Fits 1 GPU
Bigger model ≠ more earnings. Right-sized model = reliability.
4. Configuration Caching Will Bite You
Hidden state in .dapi, .inference directories means config changes get ignored if cache exists.
Solution: When changing major configs, delete cache directories and restart fresh.
Time saved: Nuclear option (delete all) takes 30 minutes. Debugging cached config takes 3 hours.
5. State Sync Requires Clean Slate
"Fresh install" means ZERO residual data. Don't try to debug with old state hanging around.
30 minutes of re-sync < 3 hours of debugging corrupted state.
6. Monitoring is Essential
- Build (or have Claude Code build) a dashboard on day one
- Log everything – you'll need it
- Automated health checks save hours of manual SSH commands
Operational Lessons
1. Security First
- Configure firewall rules BEFORE going live
- Internal ports must be blocked (9100, 9200, 8080, 5050)
- Regular security audits
- Use separate operational keys (not your main account key)
2. Backup Everything Critical
- Mnemonic phrase : Offline + encrypted (paper + USB + password manager)
- Configuration files : Version controlled
- Passwords : Secure password manager
What NOT to backup: Server data (blockchain will re-sync, no backup needed)
3. Time Estimation
- Official estimate: 2 hours
- With AI assistance: 8 hours
- Without AI assistance: 16-20 hours or give up
- Budget double the optimistic estimate
4. Community Resources
- GitHub issues are gold for troubleshooting
- Discord/community often faster than docs
- Share your learnings (like this post!)
Economics Lessons
1. Rewards Take Time
- Not instant gratification
- First rewards: After completing a full epoch
- ROI: Long-term perspective needed
2. Network Participation is Probabilistic
- Uptime affects earnings
- Validation work assigned randomly
- More nodes = more competition
- Can't force the network to send you work
3. Hardware Investment
- H100 GPU: $25k-30k
- Electricity: Non-trivial ongoing cost
- Calculate break-even point before starting
What I'd Do Differently
✅ Keep Doing:
- Detailed logging from the start
- Security-first approach
- Building monitoring tools early
- Using Claude Code for infrastructure work
❌ Change:
- Read single-GPU config examples first (before spending 3 hours on wrong model)
- Delete all state between attempts earlier (save debugging time)
- Set realistic time expectations (8 hours, not 2)
- Test inference immediately after model loads (don't wait to discover it didn't load)
"The best debugging tool? A clean slate and fresh eyes. The second best? Detailed logs from when things worked. The third best? An AI assistant that can actually execute commands and verify results."
Current Status & Next Steps
Node Health (As of 26 Hours Operational)
✅ Blockchain: Synced to block 1,979,450
✅ Network: 21 healthy peers
✅ GPU: 71.5GB model loaded, ready
✅ Services: 7/8 running (bridge stopped, not critical)
✅ Validations: 76 batches completed
⏳ Rewards: First distribution in ~19 hours (end of Epoch 127)
What's Working
- Model inference : 2-second response times ✅
- Proof of Compute : Successfully validated 76 batches ✅
- Network participation : Active in epoch 127 ✅
- Monitoring : Real-time dashboard functional ✅
What's Not (Yet)
- Bridge service : Stopped due to errors (not critical for ML operations)
- Zero balance : Waiting for epoch completion
- No recent validation work : Last 14+ hours quiet (investigating)
Immediate Next Steps
1. Monitor First Rewards (in ~19 hours)
- Will validate that setup is actually earning
- Baseline for future earnings projections
- Proof of concept success
2. Investigate Validation Silence
- Why no work assigned for 14 hours?
- Network selection algorithm behavior?
- Configuration issue?
- Just probabilistic variance?
3. Bridge Service (lower priority)
- Ethereum cross-chain functionality
- Not critical for ML inference operations
- Revisit after stable earnings confirmed
4. Optimization
- Fine-tune max_model_len parameter
- Monitor for optimal concurrent request handling
- Balance performance vs. reliability
Long-Term Goals
- Earnings Analysis : Track ROI over 30/60/90 days
- Scaling : Consider multi-GPU setup if economics work out
- Community : Share dashboard tool as open source
- Documentation : Contribute single-GPU guide back to Gonka docs
The Bigger Picture
This isn't just about running a node – it's about:
- Decentralization : Contributing to distributed AI infrastructure
- Learning : Deep dive into blockchain + ML systems
- Economics : Exploring crypto-incentivized compute markets
- Tooling : Discovering how AI assistance changes what's possible for non-experts
Community: Building in public, sharing learnings
Conclusion
Was It Worth It?
The honest answer: Ask me in 90 days when I have earnings data.
What made it worth it already:
✅ Technical Learning
- Deep understanding of vLLM and model quantization
- Practical blockchain infrastructure experience
- GPU resource management at scale
- Distributed systems debugging skills
✅ The Right Tools Matter
- Discovered the power of agentic AI for infrastructure work
- Claude Code turned 8-hour debugging sessions into 15-minute fixes
- For non-technical users : This is the key enabler
- Traditional chat AI ≠ infrastructure automation AI
✅ Problem-Solving Skills
- Model selection crisis → systematic debugging
- State sync issues → clean slate philosophy
- Configuration mysteries → cache awareness
- Dashboard development → AI-accelerated from days to hours
✅ Community Contribution
- Custom monitoring dashboard (will share as open source)
- Documented single-GPU pitfalls
- Real-world validation of official docs
- Proof that non-experts can run complex infrastructure with the right assistance
Unanswered Questions
❓ Actual earning potential (waiting for data) ❓ Long-term stability and uptime requirements ❓ Network growth impact on individual earnings ❓ Future model updates and compatibility
Who Should Run a Gonka Node?
✅ Good Fit (With Claude Code or similar AI assistant):
- Basic command line comfort (not expertise required!)
- Patient with troubleshooting
- Interested in decentralized AI
- Have GPU hardware already
- Willing to learn alongside AI assistance
- Note : You DON'T need to be a DevOps expert anymore
✅ Good Fit (Without AI Assistance):
- DevOps/SRE background required
- Deep command line expertise
- Infrastructure debugging experience
- Blockchain familiarity helpful
❌ Not Ready:
- Expecting easy passive income
- Zero willingness to troubleshoot
- Expecting instant ROI
- Not willing to use AI coding assistants (makes it MUCH harder)
Parting Wisdom
"Setting up a Gonka node isn't a 2-hour tutorial. It's an 8-hour debugging session that teaches you more about distributed AI infrastructure than any course could. But here's the thing: with Claude Code, those 8 hours are collaborative pair programming, not solo frustration. Come prepared to learn, not just to earn—and bring the right AI tools to the party."
Call to Action
- Try it : Official quickstart at
- Dashboard : I'll open-source the monitoring tool soon
- Follow along : I'll post updates on earnings after 30/60/90 days
- Connect : Share your own experiences in the comments
Final Stats
- Setup time : 8 hours (with Claude Code)
- Estimated time without AI : 16-20 hours or would've given up
- Major challenges faced : 3
- Minor issues : 5+
- Coffee consumed : Too much
- Lessons learned : Invaluable
- Would I do it again? : Absolutely
- Would I do it without Claude Code? : Probably not
Appendices
Appendix A: Command Reference
Sanitized examples of key commands used:
# Prerequisites check
nvidia-smi --query-gpu=name,memory.total,driver_version --format=csv
docker --version
docker compose version
# Firewall setup
sudo ufw allow 22/tcp
sudo ufw allow 5000/tcp
sudo ufw allow 26657/tcp
sudo ufw allow 8000/tcp
sudo ufw deny 9100/tcp
sudo ufw deny 9200/tcp
sudo ufw enable
# Node setup
git clone https://github.com/gonka-ai/gonka.git
cd gonka/deploy/join
# Edit .env and node-config.json
docker compose -f docker-compose.yml -f docker-compose.mlnode.yml up -d
# Monitoring
curl -s localhost:26657/status | jq '.result.sync_info'
docker compose logs mlnode-308 --tail=50
nvidia-smi
docker compose ps
# Dashboard (if you build it)
cd ~/gonka-setup
uv run dashboard.py
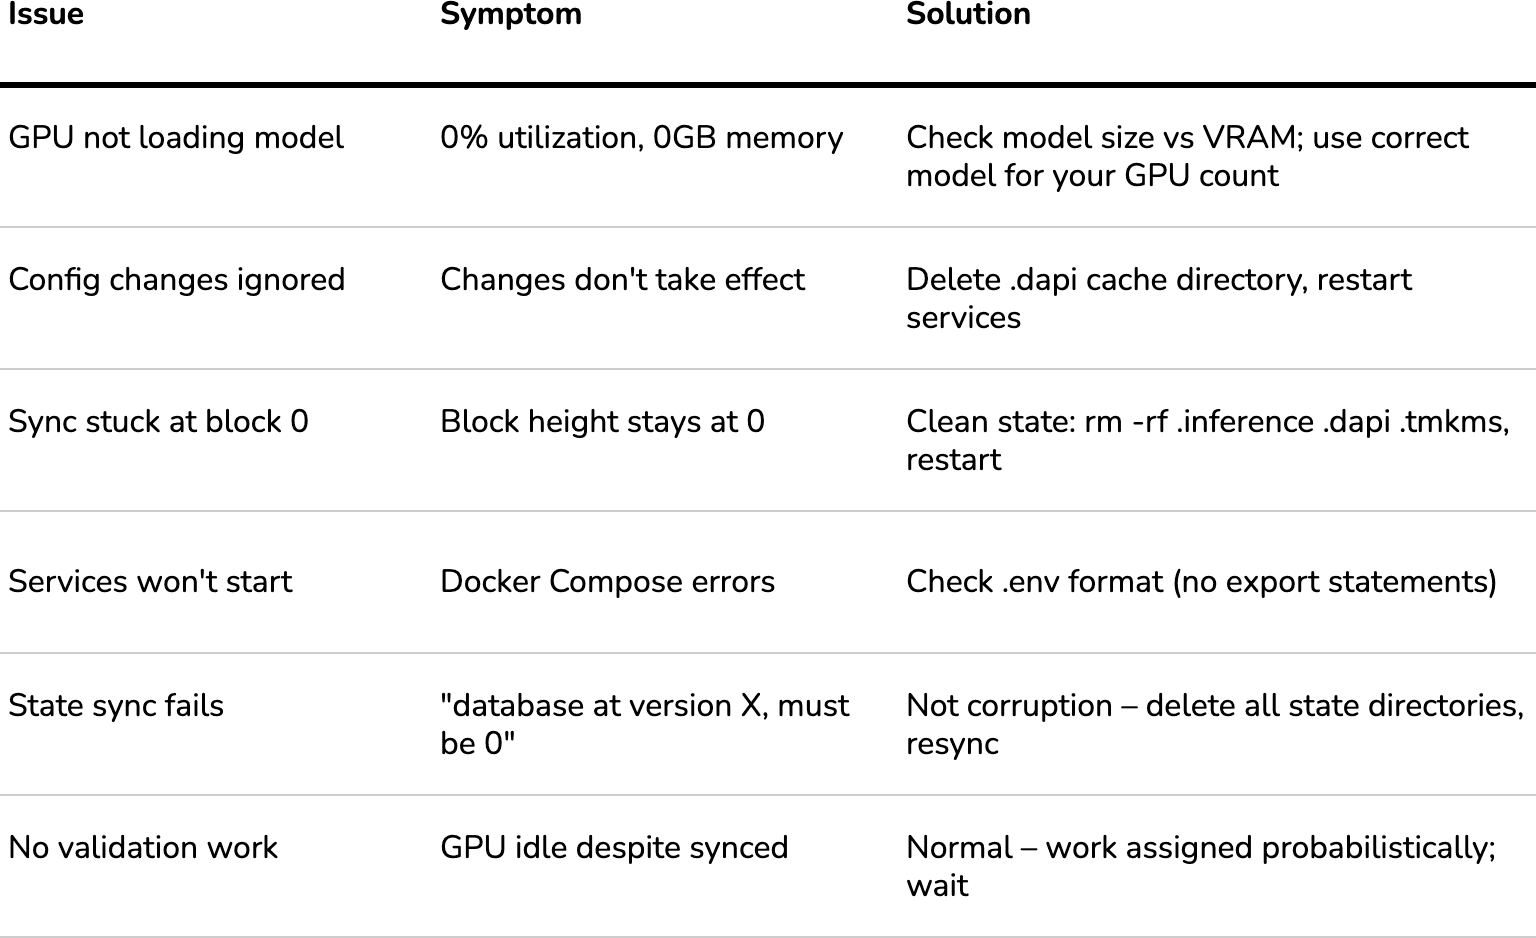
Appendix B: Troubleshooting Quick Reference
Appendix C: Resources & Links
Official:
- Gonka Docs:
- GitHub:
- Model Hub:
Tools:
- Claude Code:
- NVIDIA Drivers:
- Docker:
- Python uv:
Learning:
- vLLM Documentation:
- Rich (Python TUI):
- Tendermint/CometBFT:
Node Status Timeline
Setup Date: January 1-2, 2026
Initial Status: ✅ Operational & Synced (8/8 services)
First Rewards: Pending (Epoch 127 completion)
---
First Earnings - January 4, 2026 (Day 3)
- Epoch 127 Completed: ✅ 11,289 GONKA earned (28 coins)
- Status: First rewards successfully vested
- Conversion Rate: ~403 GONKA per coin
- Services: 7/8 running (bridge intentionally stopped)
---
Interim Update - January 7, 2026 (Day 6)
- Current Epoch: 131 (20% complete)
- Epochs Completed: 127-130 (4 epochs)
- Total Earnings: 79,946 GONKA
- Vesting: 79,490 GONKA (unlocks over ~198 days)
- Liquid Balance: 456 GONKA
- Recent Performance:
- E130: 10,880 coins → 32,681 GONKA (3.00 GONKA/coin)
- E129: 3,700 coins → 19,520 GONKA (5.28 GONKA/coin)
- E128: 1,300 coins → 16,000 GONKA (12.31 GONKA/coin)
- Work Activity: 78 validations completed, 3 fraud detections
- Network Position: 1,867 / 4,494 active participants
---
Latest Update - January 10, 2026 (Day 9)
- Current Epoch: 132 (36.5% complete)
- Epochs Completed: 127-131 (5 epochs)
- Total Earnings: 99,455 GONKA (+24% in 3 days)
- Vesting: 98,555 GONKA
- Liquid Balance: 900 GONKA (+97%)
- Epoch 131 Performance: 129 coins → ~20,468 GONKA (158.67 GONKA/coin) 🚀
- 53x better conversion rate than Epoch 130!
- Work Activity: 482 total validations (+404 in 3 days)
- Network Position: 3,403 / 4,933 active participants
- Vesting Schedule: ~401 GONKA unlocking per day
Note: This blog post contains no sponsored content. All opinions are based on actual experience. Some details (IP addresses, account addresses) have been sanitized for security.

Olena Tkhorovska
CEO + Co-Founder